A few months ago MetaQuotes released the beta version of the MetaTrader 5 Strategy Tester - Metatester 5. In this article i will do a quick review of it's options and features. Note that Metatester 5 in still in development, so new options and features can be added to it later (for example, visual backtesting and the option to display your backtested trades on the chart are missing).
There is no separate download file for the Metatester 5, the tester is one of components of the client terminal so it's distributed along with the MetaTrader 5 setup file. To open the tester press CTRL+R or click on its icon. The main window is not so different from MT4 tester. The "expert properties" button from the old tester is gone ( along with "symbol properties", "open chart" and "modify expert") the options are now present under the inputs tab and optimization properties below in the main window:

During the testing process, history for the selected currency will be automatically downloaded from the MetaQuotes servers ( around 10-15MB for one symbol). The history is stored in M1 format from 1999, before only in D1 format ( tick data or xx seconds bars are not available ). For the demo-account, the history is stored in C:\Program Files\MetaTrader 5\Bases\MetaQuotes-Demo\history\"symbol"\ folder and has the .hcc (uncompressed) format, per symbol it takes around 180MB of hdd space. Currently, there is no easy option to use separate external history like in MT4 (there is no mql5 DDE server), but according to MetaQuotes, the option to edit history and view history like in MT4 will be probably added later ( it was also recently confirmed by MetaQuotes staff on the MQL5 forums ).
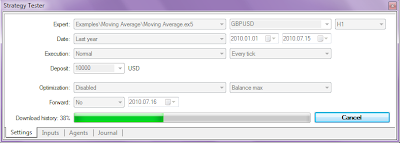

Settings in Metatester 5:
1. Optimization

Optimization ( Testing of the EA on history data with different sets of parameters, aimed at finding their best combination. During multiple runs, different combinations of the input parameters of the EA are tried and the best ones are selected. Note that an EA must have some input parameters that can be optimized like take profit, trailing or technical parameters like period etc. ). If optimization is disabled, the EA is tested with default input parameters.
- Fast Genetic Based Algorithm is based on the genetic algorithm of searching the best values of input parameters. This type is much faster than the slow complete algorithm and is almost of the same quality.
- Slow Complete Algorithm: runs are performed for all possible combinations of values of the input variables selected for optimization. This method is the most precise one, but also takes much more time.
2. Optimization Criterion

The optimization criterion is a certain factor, whose value defines the quality of a tested set of parameters. The higher the value of the optimization criterion is, the better the is testing result with the given set of parameters:
Balance max — the highest balance;
Balance + max Profit Factor — balance and profit factor;
Balance + max Expected Payoff — balance and expected payoff;
Balance + min Drawdown — balance and lowest drawdown; ( recommended )
Balance + max Recovery Factor — balance and the recovery factor;
Balance + max Sharpe Ratio — balance and the Sharpe ratio;
Custom max — the optimization criterion here is the value of the OnTester() function in the EA. This parameter allows using any custom value for the optimization of the EA.
3. Forward Mode
This option allows checking optimization results to eliminate fitting on certain time periods. During the forward optimization, the period set in the "Date" field is divided into two parts in accordance with the selected forward period (half, one third, a fourth or a custom period, when the start date of the forward testing is set). On the first part, the EA optimization is conducted. After that the best passes are selected (10% at the full parameters fitting, or 25% at a genetic algorithm), and only they are started on the forward period. The results of the best passes in the optimization on both periods can then be compared on the "Optimization Results" tab.
Tick Generation Mode
- Every tick: the most accurate mode but also the slowest one. All ticks are modeled in it;
- 1 Minute OHLC: only 4 prices (Open, High, Low and Close) of each minute bar are modeled;
- Open prices only — OHLC prices are modeled, however only the open price is used for testing/optimization.
4. Input Parameters
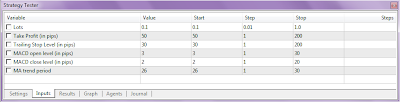
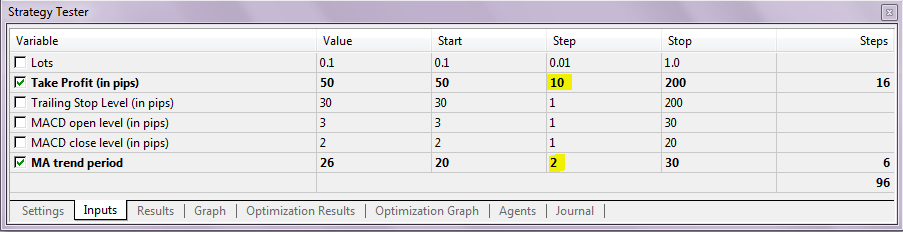
This options tab allows managing the Expert Advisor's input parameters. An EA must have at least 1 input parameter that can be optimized. Select the input parameters that must be optimized, select a start and stop value ( for example, take profit from 50 to 200 ) and a step value ( step of trying of the parameter values ). If there are to many steps, the optimization process will take a very long time. So the best strategy is to use a big step value, and then after some optimization rounds reduce it to smaller values:
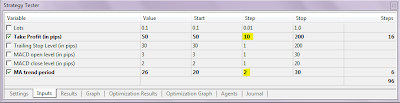
If you right click on the Input Parameters window, a context menu window will appear where you can load or save your input parameters or select the default options:

Agents:
The process of testing and optimization of Expert Advisors is performed using "agents". The number of available local agents (started on the computer where the terminal is installed) is equal to the number of logical cores of the processor. Agents are created automatically. MetaTrader 5 Strategy Tester allows working with the unlimited number of external (remote) agents using all available computation powers. I will write about it in the next article.

Optimization results:


Results of the EA's optimization are displayed on the Optimization results tab. You can sort the optimization results by data such as Result (the resulting value of the parameter that is the optimization criterion used for selecting the best runs), profit factor etc. There is also a context menu ( via right click ) where you can execute commands like "Run Single Test" (start testing of the EA with the parameters of the selected run), etc. You can also view the Optimization Graph, a visual representation of the optimization process in the Optimization Graph Tab.

Results of an EA testing are displayed in the Results tab. You can view the trading history of the EA for the period of testing and different statistical results.

In the Graph tab, the results of the EA testing are represented in a graphical form with the balance curve (blue line) and the equity curve (green). The margin level is displayed the bottom (histogram of margin level in percents). Via the context menu ( right click you can export the graph to other programs like MS Excel or save the image to clipboard.
Log
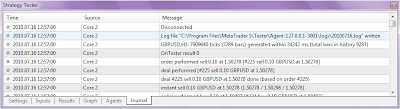
In the Log tab you can find a record of the actions, performed by the tester during the EA's testing and optimization and warning/error messages. The log file is automatically saved to the C:\Program Files\MetaTrader 5\Tester\... folder. ( *.log files ).
Read more about the MetaTrader 5 Strategy Tester here: The Algorithm of Ticks’ Generation within the Strategy Tester of the MetaTrader 5 Terminal: http://www.mql5.com/en/articles/75 and here ( at the end of the article, the optimization process is shown) - An Example of a Trading System Based on a Heiken-Ashi Indicator: http://www.mql5.com/en/articles/91
You can leave feedback, suggestions and bug reports in the Metatester 5 thread on the MQL5 website: http://www.mql5.com/en/forum/851
There is no separate download file for the Metatester 5, the tester is one of components of the client terminal so it's distributed along with the MetaTrader 5 setup file. To open the tester press CTRL+R or click on its icon. The main window is not so different from MT4 tester. The "expert properties" button from the old tester is gone ( along with "symbol properties", "open chart" and "modify expert") the options are now present under the inputs tab and optimization properties below in the main window:

During the testing process, history for the selected currency will be automatically downloaded from the MetaQuotes servers ( around 10-15MB for one symbol). The history is stored in M1 format from 1999, before only in D1 format ( tick data or xx seconds bars are not available ). For the demo-account, the history is stored in C:\Program Files\MetaTrader 5\Bases\MetaQuotes-Demo\history\"symbol"\ folder and has the .hcc (uncompressed) format, per symbol it takes around 180MB of hdd space. Currently, there is no easy option to use separate external history like in MT4 (there is no mql5 DDE server), but according to MetaQuotes, the option to edit history and view history like in MT4 will be probably added later ( it was also recently confirmed by MetaQuotes staff on the MQL5 forums ).


Settings in Metatester 5:
1. Optimization

Optimization ( Testing of the EA on history data with different sets of parameters, aimed at finding their best combination. During multiple runs, different combinations of the input parameters of the EA are tried and the best ones are selected. Note that an EA must have some input parameters that can be optimized like take profit, trailing or technical parameters like period etc. ). If optimization is disabled, the EA is tested with default input parameters.
- Fast Genetic Based Algorithm is based on the genetic algorithm of searching the best values of input parameters. This type is much faster than the slow complete algorithm and is almost of the same quality.
- Slow Complete Algorithm: runs are performed for all possible combinations of values of the input variables selected for optimization. This method is the most precise one, but also takes much more time.
From the MQL5 documentation: Genetic optimization is based on the constant selection of the most "adapted" parameters (values that give the best result). From the total number of all possible combinations of parameters, two populations (sets) are selected by a random sample. After that, both sets are tested and the one with the best results (according to the optimization criterion) is left. The set members are randomly crossed with one another, undergoing random mutations and inversions of parameters. The descendants are sorted out by the best results, and crossing repeats.- All Symbols Selected in Market Watch: unlike the above described optimization types, this one allows to test an EA with the same input parameters but using different symbols. Only the main symbol of testing is changed in each pass, i.e. the symbol of chart the EA would be attached to. The optimization is performed only with symbols that are currently chosen in the "Market Watch" window. So, by selecting the various symbols, you can manage the optimization.
Operations of sorting and crossing repeat until there is improvement of results (the best result among descendants is better than the best one among the parents). The completion of optimization requires absence of improvement of the optimization criterion during several crossings (generations). During a genetic optimization, the number of testing runs is much lower, which provides such a quickness of optimization.
2. Optimization Criterion

The optimization criterion is a certain factor, whose value defines the quality of a tested set of parameters. The higher the value of the optimization criterion is, the better the is testing result with the given set of parameters:
Balance max — the highest balance;
Balance + max Profit Factor — balance and profit factor;
Balance + max Expected Payoff — balance and expected payoff;
Balance + min Drawdown — balance and lowest drawdown; ( recommended )
Balance + max Recovery Factor — balance and the recovery factor;
Balance + max Sharpe Ratio — balance and the Sharpe ratio;
Custom max — the optimization criterion here is the value of the OnTester() function in the EA. This parameter allows using any custom value for the optimization of the EA.
3. Forward Mode
This option allows checking optimization results to eliminate fitting on certain time periods. During the forward optimization, the period set in the "Date" field is divided into two parts in accordance with the selected forward period (half, one third, a fourth or a custom period, when the start date of the forward testing is set). On the first part, the EA optimization is conducted. After that the best passes are selected (10% at the full parameters fitting, or 25% at a genetic algorithm), and only they are started on the forward period. The results of the best passes in the optimization on both periods can then be compared on the "Optimization Results" tab.
Tick Generation Mode
- Every tick: the most accurate mode but also the slowest one. All ticks are modeled in it;
- 1 Minute OHLC: only 4 prices (Open, High, Low and Close) of each minute bar are modeled;
- Open prices only — OHLC prices are modeled, however only the open price is used for testing/optimization.
4. Input Parameters

This options tab allows managing the Expert Advisor's input parameters. An EA must have at least 1 input parameter that can be optimized. Select the input parameters that must be optimized, select a start and stop value ( for example, take profit from 50 to 200 ) and a step value ( step of trying of the parameter values ). If there are to many steps, the optimization process will take a very long time. So the best strategy is to use a big step value, and then after some optimization rounds reduce it to smaller values:
If you right click on the Input Parameters window, a context menu window will appear where you can load or save your input parameters or select the default options:

Agents:
The process of testing and optimization of Expert Advisors is performed using "agents". The number of available local agents (started on the computer where the terminal is installed) is equal to the number of logical cores of the processor. Agents are created automatically. MetaTrader 5 Strategy Tester allows working with the unlimited number of external (remote) agents using all available computation powers. I will write about it in the next article.

Optimization results:


Results of the EA's optimization are displayed on the Optimization results tab. You can sort the optimization results by data such as Result (the resulting value of the parameter that is the optimization criterion used for selecting the best runs), profit factor etc. There is also a context menu ( via right click ) where you can execute commands like "Run Single Test" (start testing of the EA with the parameters of the selected run), etc. You can also view the Optimization Graph, a visual representation of the optimization process in the Optimization Graph Tab.
From the MQL5 documentation:Strategy testing results:
- Pass — pass number;
- Result — the resulting value of the parameter that is the optimization criterion used for selecting the best runs;
- Profit — obtained profit/loss for this run;
- Total trades — total number of trades executed for the run;
- Profit factor — ration of the total profit to the total loss in percents. One means that the total of profits is equal to the total of losses;
- Expected payoff — this is a statistically calculated value that reflects the average profitability/loss of one trade;
- Drawdown — the relative drawdown of equity, the largest loss in percents from the maximal value of equity;
- Recovery factor — this value reflects the riskiness of the strategy - the amount of money risked by the Expert Advisor to make the profit it obtained. It is calculated as the ratio of a profit obtained to the maximal drawdown;
- Sharpe Ratio — this ratio characterizes efficiency and stability of a strategy. It reflects the ratio of the arithmetical mean profit for the position holding time to the standard deviation from it. Plus to that, it accounts for the risk-free rate which is the profit on a certain deposited amount of money;
- Optimized inputs — in addition to the common statistical values, values of input parameters set for this run are shown here.

Results of an EA testing are displayed in the Results tab. You can view the trading history of the EA for the period of testing and different statistical results.
From the MQL5 documentation:Via the context menu ( right click ) you can export the report as a html/xml file.
- Initial Deposit — the initial deposit for testing;
- Bars — number of bars generated for the symbol the testing is conducted on;
- Ticks — number of ticks during testing;
- Gross Profit — sum of all profitable trades in monetary units;
- Gross Loss — sum of all losing trades in monetary units;
- Total Net profit — the financial result of all trades. This values is the difference between the Gross Profit and Gross Loss;
- Profit Factor — ratio of the gross profit to the gross loss in percents. One means that the sum of profits is equal to the sum of losses;
- Expected Payoff — this is a statistically calculated value showing the average profitability/loss of one deal. This value can also be considered as a forecasted profitability/loss of the next deal;
- Recovery Factor — this value reflects the riskiness of the strategy - the amount of money risked by the Expert Advisor to make the profit it obtained. It is calculated as the ratio of a profit obtained to the maximal drawdown;
- Sharpe Ratio — this ratio characterizes efficiency and stability of a strategy. It reflects the ratio of the arithmetical mean profit for the position holding time to the standard deviation from it. Plus to that, it accounts for the risk-free rate which is the profit on a certain deposited amount of money;
- Balance Drawdown Absolute — the maximal loss on the balance below the initial deposit;
- Balance Drawdown Maximal — the maximal loss from the local maximum in the deposit currency and as percent from the deposit;
- Balance Drawdown Relative — the maximal drawdown from the highest balance value in percents, and the appropriate money value;
- Equity Drawdown Absolute — the largest loss on assets below the initial deposit;
- Equity Drawdown Maximal — the largest loss from the local maximum in the deposit currency and as percent from the deposit;
- Equity Drawdown Relative — the largest loss in percents from the maximal value of assets, and the appropriate money value;
- Total trades — the total number of executed trades;
- Short Positions (won %) — number of short positions and percent of winning short positions;
- Long Positions (won %) — number of long positions and percent of winning long positions;
- Profit Trades (% of total) — number of winning trades and their percentage in the total number of trades;
- Loss trades (% of total) — number of losing trades and their percentage in the total number of trades;
- Largest profit trade — the largest profit among all winning trades;
- Largest loss trade — the largest loss among all losing trades;
- Average profit trade — the average profit value per a trade (the total of profits divided by the number of winning trades);
- Average loss trade — the average loss value per a trade (the total of losses divided by the number of losing trades);
- Maximum consecutive wins ($) — the longest series of winning trades and their total profit;
- Maximum consecutive losses ($) — the longest series of losing trades and their total loss;
- Maximal consecutive profit (count) — the maximal profit for one series of winning trades and the number of winning trades in it;
- Maximal consecutive loss (count) — the maximal loss for one series of losing trades and the number of losing trades in it;
- Average consecutive wins — the average number of winning trades in winning series;
- Average consecutive losses — the average number of losing trades in losing series.

In the Graph tab, the results of the EA testing are represented in a graphical form with the balance curve (blue line) and the equity curve (green). The margin level is displayed the bottom (histogram of margin level in percents). Via the context menu ( right click you can export the graph to other programs like MS Excel or save the image to clipboard.
Log

In the Log tab you can find a record of the actions, performed by the tester during the EA's testing and optimization and warning/error messages. The log file is automatically saved to the C:\Program Files\MetaTrader 5\Tester\... folder. ( *.log files ).
Read more about the MetaTrader 5 Strategy Tester here: The Algorithm of Ticks’ Generation within the Strategy Tester of the MetaTrader 5 Terminal: http://www.mql5.com/en/articles/75 and here ( at the end of the article, the optimization process is shown) - An Example of a Trading System Based on a Heiken-Ashi Indicator: http://www.mql5.com/en/articles/91
You can leave feedback, suggestions and bug reports in the Metatester 5 thread on the MQL5 website: http://www.mql5.com/en/forum/851


