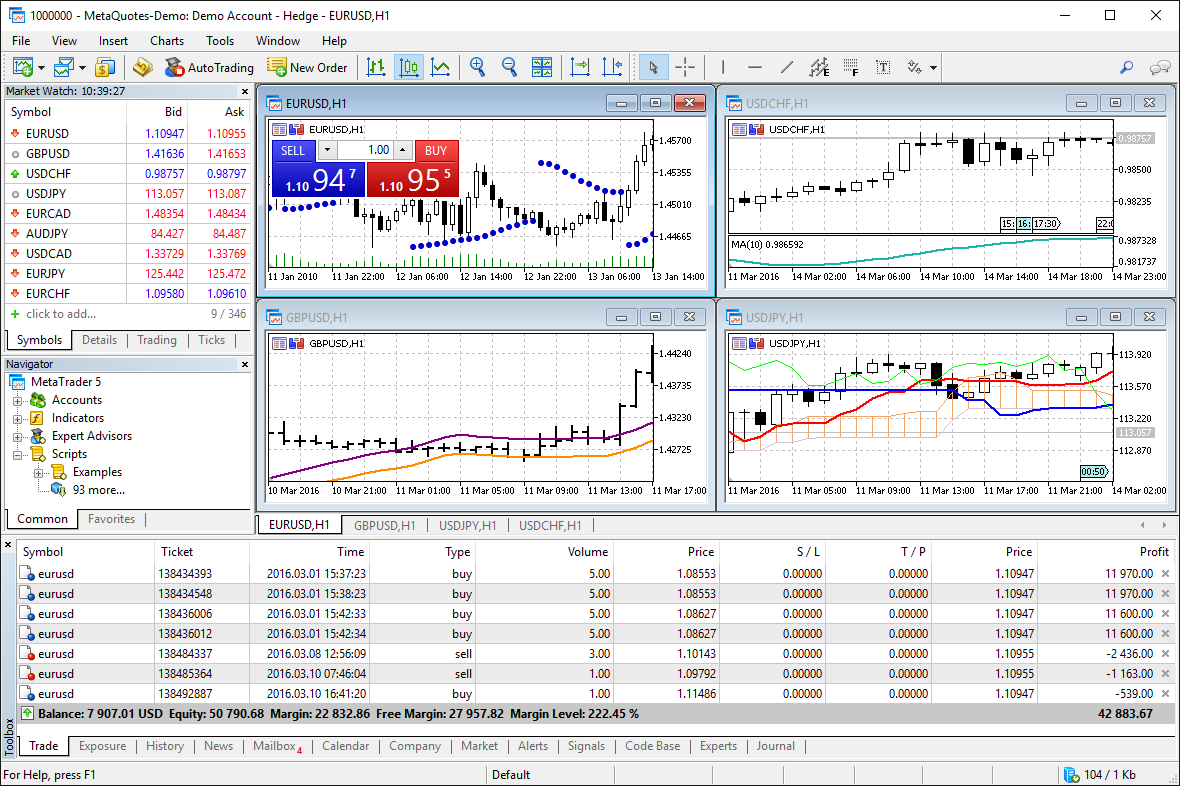
Analytics is one of the most important components of MetaTrader 5. Based on analytical data, a trader can decide what operation to execute, when to do it and what profit could be gained. The MetaTrader 5 offers you wide analytical possibilities!
ChartsCharts constitute a work field for technical analysis. This is where dynamics of security quotes are featured, technical indicators and graphical objects are applied. The number of charts that can be used in a terminal is unlimited, and they can be positioned in any way. This enables traders to adjust their workplaces to their own needs.
Every chart can be individually set up. Traders can use the detailed setup of color schemes, displaying of additional data objects and scaling, which allows the configuration of every chart according to the needs of a certain analytical tool. For example, you can setup the displaying of separators for larger periods, the OHLS line, and the chart scaling for the adequate featuring of Gann tools.

Chart Properties Window

Charts Profiles and Templates
The main limitation of timeframes is their multiplicity: one hour must contain an integer number of minute periods, and a day must consist of an integer number of hour periods. According to this rule, the following timeframes are available in the terminal: M1, M2, M3, M4, M5, M6, M10, M12, M15, M20 and M30.The available hour periods are: H1, H2, H3, H4, H6, H8 and H12. Three more timeframes are D1, W1 and MN1. So many available timeframes allow using any analytical tools, detecting long and short-term trends, and precisely defining entry and exit points.

Timeframe Toolbar
A space-efficient format of data storing is implemented in MetaTrader 5. Thus, the ten years' 1-minute history of quotes for GBPUSD takes as little as 10 megabytes. Having uploaded this history once, you can build all the charts for this symbol, from M1 to MN1.
The terminal offers three chart types to display data: linear chart, candlesticks and bars. So, you can choose the most convenient one for analyzing prices. To help you analyze, the terminal contains 38 built-in technical indicators and 39 analytical objects.Indicators
Technical indicators are automatic tools generating signals based on various calculations. The built-in indicators of the MetaTrader 5 terminal cover almost all needs for analytical tools. The terminal offers you the most popular trend indicators, oscillators, Bill Williams' tools and many other instruments. Should you need any specialized tool, you can write it in the MQL5 language or download/purchase a ready-made program.

Technical Indicators in MetaTrader 5

Indicators Applied to Other Indicators in MetaTrader 5
Objects
Unlike indicators, analytical objects aren't automatic, and should be applied to a chart or indicator manually. Custom objects can't be developed in MQL5, that's why we tried to include as many analytical objects as possible, to help traders analyze prices.

'Simple' Analytical Tools in MetaTrader 5

Interactive analytical Tools in MetaTrader 5
Article Source
0 comments
Post a Comment