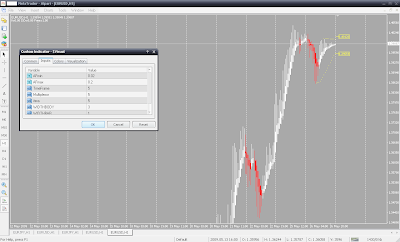
There are 2 versions of the alternative price chart display indicator:
1. Svisual:
1. Svisual 2 ( 2 price charts, one fast - white/red and one slow - dark )
Indicator options:
- Timeframe - which timeframe bars are taken for startpoint calculation
- Multiplexor - timeframe bar value, for example: 1st bar represents the last 5 minutes from the 1 minute timeframe, second bar is last 5 + 2 minutes before 1st bar, third bar - last 5 + 2 + 2 minutes before 2nd bar etc, so every previous bar represents 2 minutes more than the following bar. This value is called Multiplexor, in this case Multiplexor = 2.
- Itera - Heiken Ashi smoothing value. Should be 4-6.
The Alternative price chart display indicators are free to use. Download them here
For more information about this indicator read this post


0 comments
Post a Comment