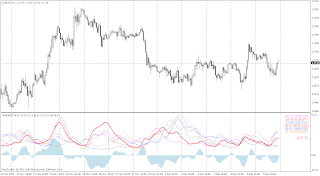
ADX (Average Directional Index) is a well known classical indicator that is used to evaluate the strength of a current trend, be it up or down. The main indicator ADX shows the strength of a trend, and two additional +DI and-DI - the bull and bear forces. ADX is mostly used as a confirmation indicator before entering the market. However the information provided by ADX becomes only really valuable if you compare it to the ADX from other symbols. The Multi ADX indicator is designed to do that. It offers a comparison between the ADX of the current symbol and up to 5 other symbols:
Look at the red arrows on the chart below. You can see that the information provided by the the ADX from other symbols (In this case GPBUSD and NZDUSD) helps to analyze the current (complex) market state before opening a position.
Only imposing of ADX charts against each other allows to estimate the current condition of the market for different currency pairs, and not simply to wait from ADX for acknowledgment of the beginning of a trend, but to actively choose for the market with stronger movement.
Indicator properties that you can change:
MainPeriod - ADX Value;
Smooth - Level of smoothing of a curve;
ADX_Width - a thickness of a line of the ADX indicator;
DI_Width - the thickness of DI histogram;
FontName, FontSize;
IndicatorName- For work with several MultiADX indicators their names should differ;
C1... C6 - color of a line of symbol 1... 6;
P1... P6 - symbols for ADX charts;
Current - Color for allocation of the line of current symbol;
DI - DI histogram color.
The Multi ADX indicator is free to use. Download it here
Read more about the ADX here
0 comments
Post a Comment