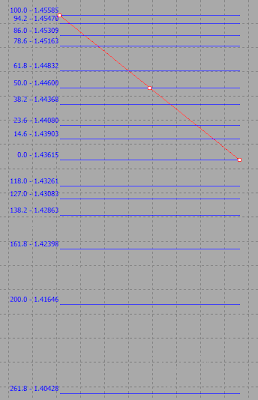
Fibonacci retracement is a very popular and extremely useful for setting the stop-loss and take-profit levels and strategic places for transactions. The notion of retracement is used in many technical indicators such as Gartley patterns, Tirone levels, Elliott Wave theory etc. Many traders use Fibonacci retracement indicators in their daily or long-term Forex trading. These methods are good known in the Forex community and have a lot of literature en resources about them. Fibonacci retracement is created by taking two extreme points (local top and bottom) and dividing the vertical distance by the key Fibonacci ratios as showed on the picture below. The horizontal lines are used to identify possible support and resistance levels.
In this article we are going to customize the Fibonacci settings within Metatrader 5 so that it can plot both retracements & extensions simultaneously.

In Metatrader 5 you can find the tool under the menu Insert >> Objects >> Fibonacci >> Fibonacci Retracement. On the chart simply do a random placement, place it anywhere on the chart, does not matter:

Then, Right-click anywhere on your chart where there is open space. Select Objects List from the pop-up menu ( or press Ctrl + B on the keyboard ) and left-click. Within the Objects window, select Fibo and then click on the Edit button. You should see this:

On the Fibo properties screen, use the Delete button to remove all existing levels. After that use the Add button to add the following values as shown below and click OK.

Main Fibonacci Retracements Levels:
| Level 0 0.146 0.236 0.382 0.5 0.618 0.786 0.86 0.942 1 -0.18 -0.27 -0.382 -0.618 -1 -1.618 -3.236 | Description 0.0 - %$ 14.6 - %$ 23.6 - %$ 38.2 - %$ 50.0 - %$ 61.8 - %$ 78.6 - %$ 86.0 - %$ 94.2 - %$ 100.0 - %$ 118.0 - %$ 127.0 - %$ 138.2 - %$ 161.8 - %$ 200.0 - %$ 261.8 - %$ 423.6 - %$ |
After that you should see the following prices and percentages appearing on the Fibonacci line labels:

As described above, a Fibonacci Retracement is created by taking a local top and bottom and dividing them with the vertical distance line:

Here are the C-to-D rules:
23.6% >> 118% | 127%
38.2% >> 138.2%
50% | 61.8% >> 161.8%
78.6% >> 0% | 161.%
86.0 >> 0%
100.0+ >> Reversal ( thanks to Black_Knight for the C-to-D rules)
In the future, i will write more about the trading techniques with Metatrader 5 Fibonacci Retracements. For example, you can draw the Fibonacci Retracement at the beginning of the day to know the direction of the movement expected and it is important to have two points of view, one large view, where the Fibonacci Retracement is located on the historical high and one other small view with the last daily high. Try to compare the moment position to these two Fibonacci levels and the daily pivot levels so you can locate the important support and resistance levels.
You can also read more about the trading here.
Can someone explain 118 and 127? I've never seen these levels before
ReplyDelete