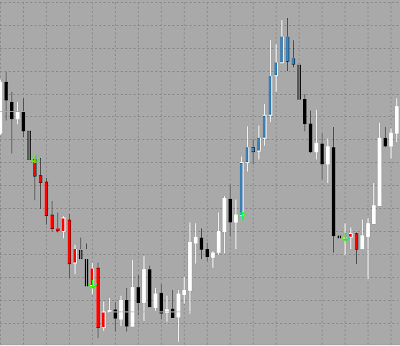
Fractals Period for Metatrader 5 (author - Alexander Piechotta, see original post here)
The Fractals indicator is one of the five indicators of Bill Williams’ trading system, which allows you to detect the bottom or the top of the current trend. However, the main drawback with fractals is that they are lagging indicators because a fractal can't be drawn until the bars have appeared. Thats why fractals are best used in combination with other indicators like the popular "Alligator indicator". This Fractals Period indicator allows you to specify the number of bars separately before and after the current High / Low. As you can see on the screenshot below, the fractals are indicated with the up and down arrows.
You can customize the following input parameters:
CompleteBarsOnly - Converts only with finished bars
FractalsPeriodBefore - Number of bars before the current High / Low
FractalsPeriodAfter - Number of bars after the current High / Low
Maxbar - max. Number of bars in the calculation.
The indicator uses the CalcFrac Class (calculate fractals by array values), so place the file "CalcFrac.mqh" in the \MetaTrader 5\MQL5\Include\ folder
Download the indicator
Download CalcFrac.mqh
And some new indicators from Andrei @ Earn Forex Blog:
Aroon indicator for Metatrader 5
Aroon is a technical indicator, very similar to the directional movement index (DMI) which measures the strength of a given trend. It us used for identifying trends and the likelihood that the trends will reverse. It can help you to detect the local tops and bottoms on the chart. The Aroon indicator reports the time it's taking for the price to reach, from a custom starting point, the highest and lowest points over a given time period, each reported as a percentage of total time. You can specify the Aroon Period in the input parameters of the indicator. Read more about Aroon here.

Download ( see original post here )
CCI Arrows for Metatrader 5
A simple indicator that will show you where the CCI (Commodity Channel Index, a momentum oscillators) cross with the zero occur. CCI can be used to identify overbought and oversold levels and is also valuable for identifying reversals. However, it should not be used as a signal indicator, but only for technical analysis to confirm the current trend. The CCI cross is marked with arrows. You can specify the CCI Period in the input parameters of the indicator.

Download ( see original post here )
Easy Trend Visualizer for Metatrader 5
This indicator is based on the ADX (Average Direction Movement Index), which measures the strength of a trend and can be used to determine if a trend is strong or weak. High readings indicate a strong trend and low readings indicate a weak trend. It is not a signal indicator, it only tells you how strong the current trend is. So use it as a part of you trading system.
In the input parameters you can specify the 3 ADX parameters ( from faster to slower) and the colors of the bars.

Download ( see original post here )

0 comments
Post a Comment